论文传送门
视频
作者
北京大学
- Yucheng Huang
- Tong Yang
中国科学院软件研究所计算机科学实验室
- Lei Shi
- Yue Su
- Deyun Wang
雅虎实验室
- Yifan Hu
亚利桑那州立大学
- Hanghang Tong
圣母大学
- Chaoli Wang
清华大学美术学院
- Shuo Liang
摘要
影响力演化图的可视化对于执行许多现实生活任务(例如引文分析和社会影响分析)很重要。主要挑战包括如何总结大规模、复杂和随时间变化的影响图,以及如何设计有效的视觉隐喻和动态表示方法来说明随时间推移的影响模式。在这项工作中,我们介绍了Eiffel,这是一个集成的可视化分析系统,该系统对节点,关系和时间纬度的影响力演化图进行了三次汇总。在数值实验中,就基于影响流的目标而言,Eiffel汇总结果优于传统聚类算法。此外,提出了一种流程图表示法,并适用于影响图摘要的情况,它支持两种演化可视化模式(即翻书和电影),以加快对影响图动力学的分析。我们进行了两个受控用户实验,以分别评估影响图摘要和可视化方面的技术。我们还在两种典型情况的影响力演化分析中展示了该系统,这两种情况是科学论文的引文影响和新兴在线事件的社会影响。评估结果证明了Eiffel在影响演化图的可视分析中的价值。
Introduction
影响力
- Cyber-Influence (社交)
- Social Influence(意见领袖)
- Physical-Influence (蝴蝶效应)
- Diffuse ideas like epidemic
- Induce friends to behave similarly
- Develop community through paper co-authorship, citation, co-citations, shared topics, etc.
学术论文引文的影响力图
Entity: papers(authors)
Relationship: citations
Usage: understand the development of topics from a landmark paper
Challenge: size and complexity of the influence graph for understanding
消息转发的社会影响力图
Entity: tweets(users)
Relationship: re-tweets(comments)
Usage:
- Understand the nature of propagation
- Amplify/contain the impact for social compaigns
Challenge: visualize the dynamics of influence graph
Related Work
Information Propagation Visualization
- Whisper
- G+ Ripples
Research Problem
节点:影响源、传播者
影响边:反向的引用或转发关系
最大影响图:influencer + propagators + influence links
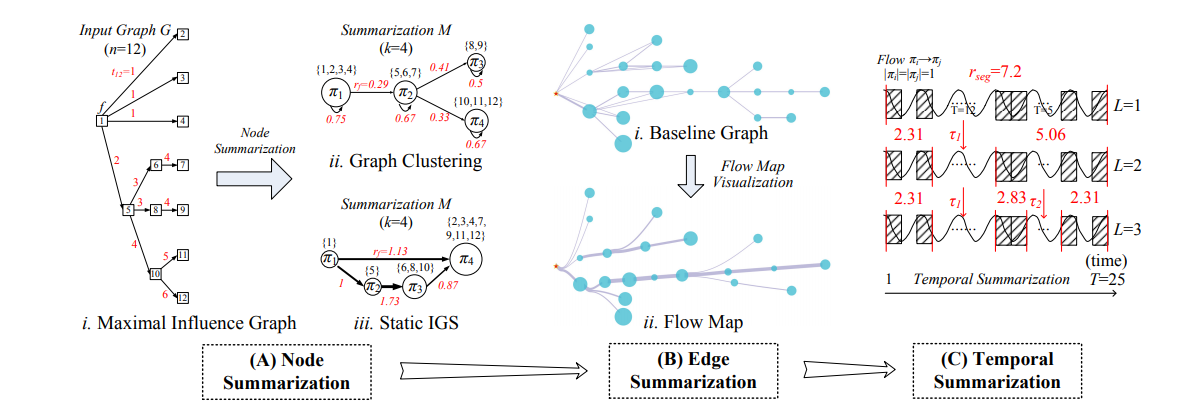

Node Summarization
SymNMF algorithm (node clustering)
similarity matrix:
A G = A A T + A T A 2 A^{G}=frac{A A^{T}+A^{T} A}{2} AG=2AAT+ATA?
SymNMF:
min ? H ≥ 0 ∥ A G ? H H T ∥ F 2 min _{H geq 0}left|A^{G}-H H^{T}right|_{F}^{2} minH≥0?∥∥?AG?HHT∥∥?F2?
基本原理:
- Similarity defined by # of commonly cited/citing papers(co-citation)
- Proved for maximizing the objective function
Comparison with graph clustering, k-means
Findings:
- Graph
- Large graphs, all methods fail on content consistency
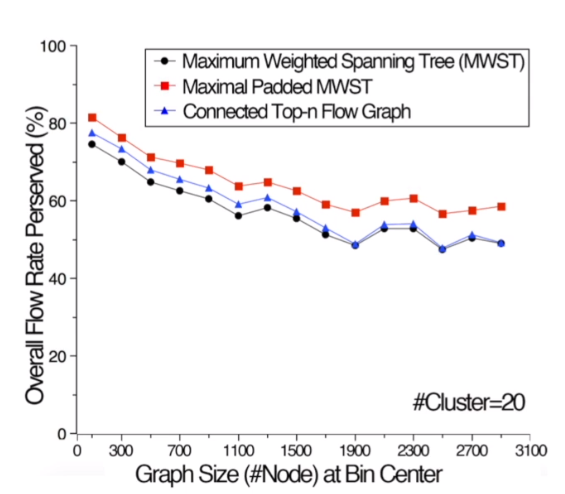
Findings:
- Maximal padded MWST preserves a higher percent of overall flow rate
Temporal Summarization
Objective & algorithm
- Divide the timeline into L L L time frames for large influence links
r s e g ( ξ ( g ) ) = ∑ e i j ∈ ξ , t i j ∈ W g a i j ∣ π S ( ξ ) ∣ ∣ π D ( ξ ) ∣ ? ∑ e i j ∈ ξ , t i j ∈ W g a i j ∣ W g ∣ ? ∣ W g ∣ qr_{s e g}left(xi^{(g)}right)=frac{sum_{e_{i j} in xi, t_{i j} in W_{g}} a_{i j}}{sqrt{left|pi_{S(xi)}right|left|pi_{D(xi)}right|}} cdot frac{sum_{e_{i j} in xi, t_{i j} in W_{g}} a_{i j}}{left|W_{g}right|} cdotleft|W_{g}right|^{q} rseg?(ξ(g))=∣πS(ξ)?∣∣πD(ξ)?∣?∑eij?∈ξ,tij?∈Wg??aij???∣Wg?∣∑e来源:algzjh
声明:本站部分文章及图片转载于互联网,内容版权归原作者所有,如本站任何资料有侵权请您尽早请联系jinwei@zod.com.cn进行处理,非常感谢!