转自:http://www.dataguru.cn/article-2421-1.html
摘要: 一、直方图 绘制直方图函数:hist()对x1进行直方图分析 hist(x$x1)二、散点图 散点图绘制函数:plot()探索各科成绩的关联关系 plot(x1,x2) plot(x$x1,x$x2)三、柱状图 列联表分析 列联函数table():统计每个分数的人 …
一、直方图
绘制直方图函数:hist()
对x1进行直方图分析
2、利用内置的mtcars数据集绘制
首先要将数据框转换为矩阵。颜色越深,数值越大。
heatmap(as.matrix(mtcars),
Rowv=NA,
Colv=NA,
col = heat.colors(256),
scale=”column”,
margins=c(2,8),
main = “Car characteristics by
Model”)
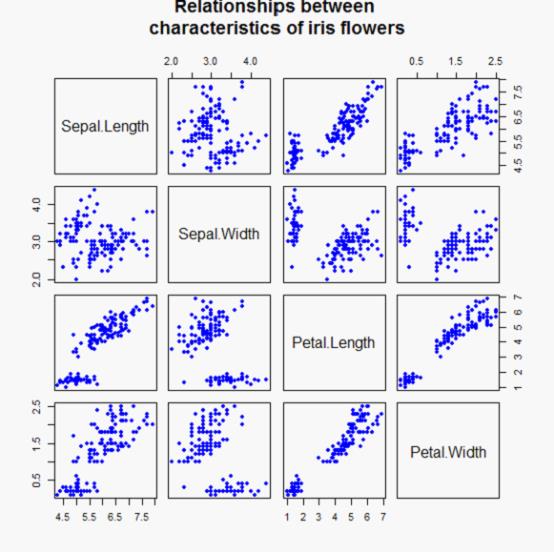

十三、向日葵散点图
1、Iris(鸢尾花)数据集
2、向日葵散点图
函数:sunflowerplot(),参数col设定点的颜色,seg.col设定点发出的射线(代表重合点)的颜色。
(1) 用来克服散点图中数据点重叠问题
(2) 在有重叠的地方用一朵“向日葵花”的花瓣数目来表示重叠数据的个数
十五、关于绘图参数
1、寻求帮助
(1) help(par)
(2) 有哪些颜色使用函数 colors()2、绘图设备
dev.cur()
dev.list()
dev.next(which = dev.cur())
dev.prev(which = dev.cur())
dev.off(which = dev.cur())
dev.set(which = dev.next())
dev.new(…)
graphics.off()3、位置控制参数
(1) mai参数:A numerical vector of the form c(bottom, left, top, right) which gives the margin size specified in inches.
(2) oma参数:A vector of the form c(bottom, left, top, right) giving the size of the outer margins in lines of text.
十六、三维散点图安装scatterplot3d 包
scatterplot3d(x[2:4])
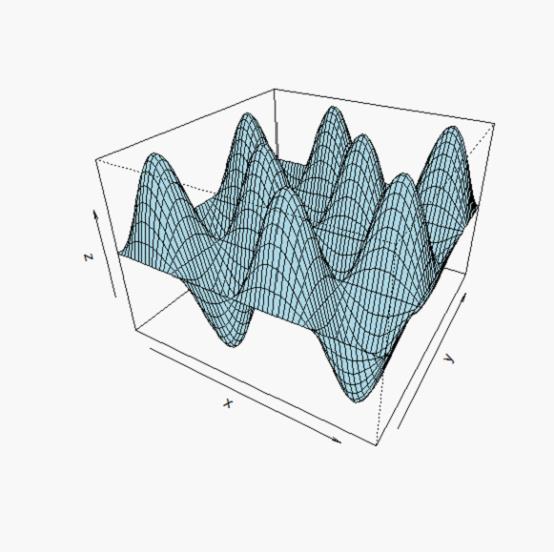
十七、三维作图x f z contour(x,y,z,col="blue")
persp(x,y,z,theta=30, phi=30,expand=0.7,col="lightblue")
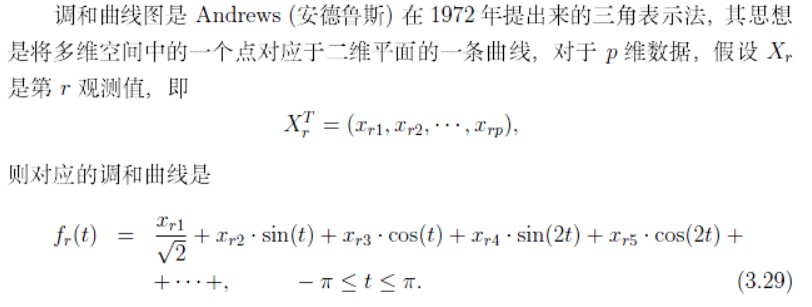
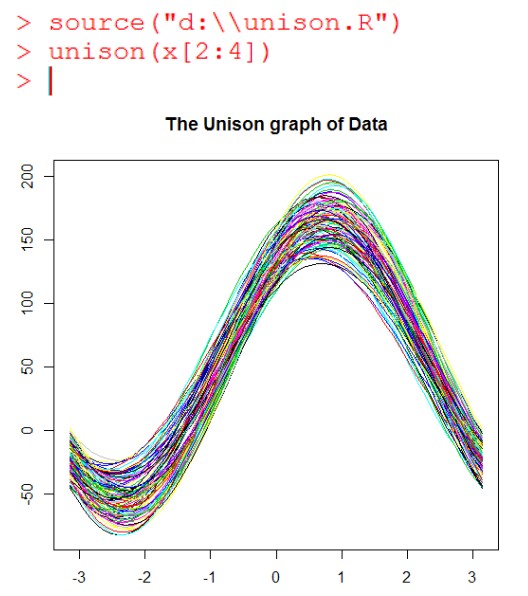
十八、调和曲线图
调和曲线用于聚类判断非常方便。自定义函数unison的脚本unison.r:
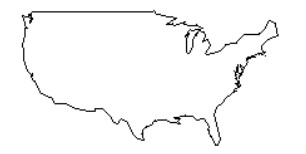
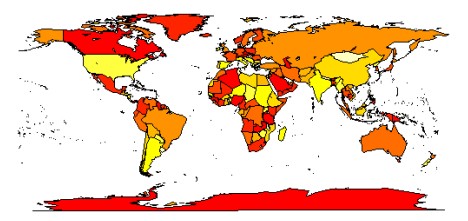
十九、地图安装maps包
map(“state”, interior = FALSE)
map(“state”, boundary = FALSE, col=”red”,add = TRUE)
map(‘world’, fill = TRUE,col=heat.colors(10))
相关R绘图书籍:《R Graphs Cookbook》
来源:黑子小明
声明:本站部分文章及图片转载于互联网,内容版权归原作者所有,如本站任何资料有侵权请您尽早请联系jinwei@zod.com.cn进行处理,非常感谢!