本次TeeChart Pro .NET使用教程将为大家带来如何使用系列类型。
TeeChart Pro 将自动为您定义所有 Axis 标签,并提供足够的灵活性来定制您可能有的任何特定要求。 TeeChart Pro 提供真正的多轴。 这些在设计或运行时可用,并为 Axis 定义提供了无数的可能性和灵活性。
点击立即下载最新版TeeChart for .NET
系列类型
TChart Series 类是所有 Series 类型的共同祖先。当使用 TeeChart 在线帮助获取有关任何系列类型的帮助时,请点击位于继承类型列表中的系列类的链接,然后单击系列成员,其中将包含所有继承属性和方法的列表。
系列类结构
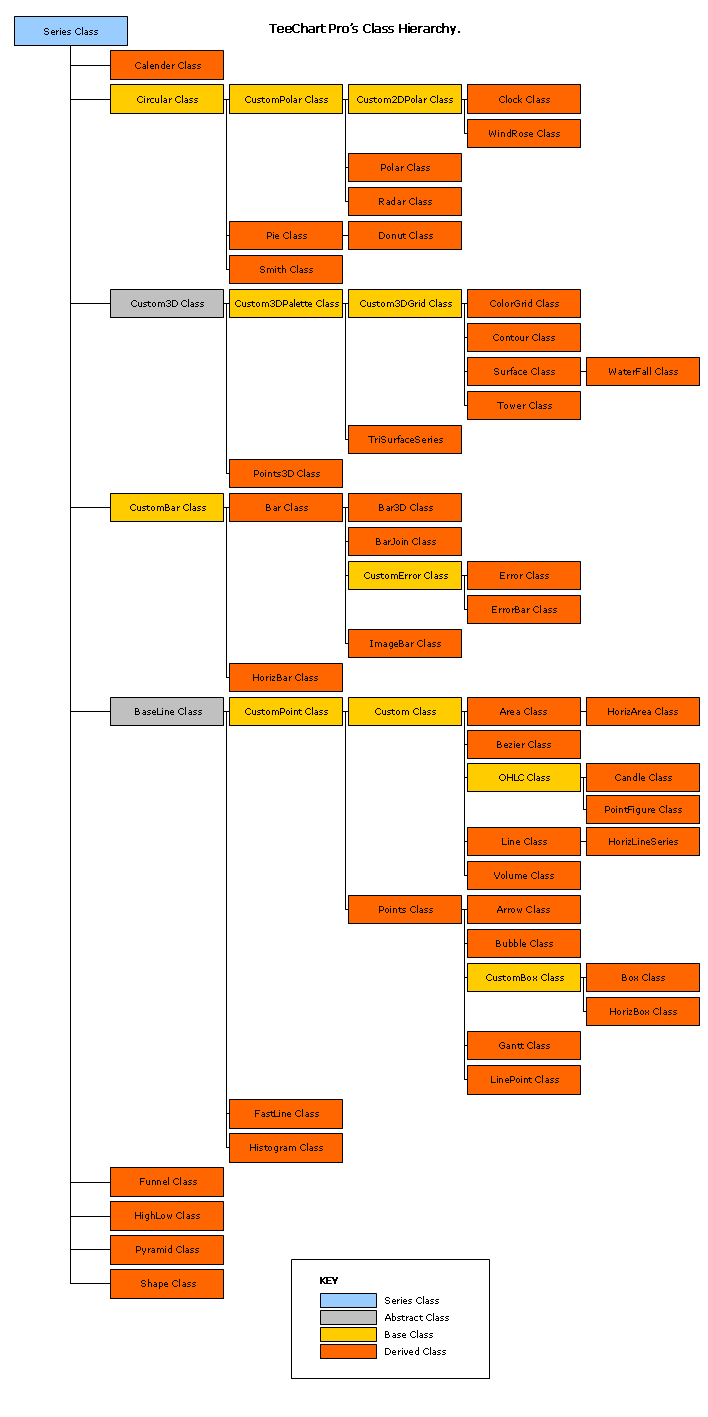
作为 TeeChart 类型库结构的一点背景知识,这里是对 Series 类和接口的解释。下图显示了 TeeChart Series 类之间的关系。所有类都派生自通用“Series”类,因此共享“Series”属性和方法。几个抽象类派生自 Series(Custom3DSeries、CustomBarSeries 和 CircledSeries),它们以灰色突出显示,并且它们的接口不能直接用于编程,它们的特性由它们的后代 Series 类型继承。所有派生系列(橙色)都可以在 TeeChart 库中访问,以包含在您的图表中。以这种方式派生的 TeeChart 系列允许通过公共索引结构对继承的属性和方法进行可编程访问。

在设计时使用图表编辑器添加系列更容易,但您也可以在运行时创建新的和不同的系列类型并将其添加到同一 TChart。
[C#]//Add a series at runtimeprivate void button1_Click(object sender, System.EventArgs e) { Steema.TeeChart.Styles.Area tmpAreaSeries = new Steema.TeeChart.Styles.Area(tChart1.Chart); tmpAreaSeries.FillSampleValues(4); //Or //Steema.TeeChart.Styles.Area tmpAreaSeries = new Steema.TeeChart.Styles.Area(); //tChart1.Series.Add(tmpAreaSeries); //tmpAreaSeries.FillSampleValues(4); }[VB.Net]'Add a series at runtimePrivate Sub Button1_Click(ByVal sender As System.Object, ByVal e As System.EventArgs) Handles Button1.Click Dim tmpAreaSeries As New Steema.TeeChart.Styles.Area(TChart1.Chart) tmpAreaSeries.FillSampleValues(4) 'Or 'Dim tmpAreaSeries As New Steema.TeeChart.Styles.Area() 'TChart1.Series.Add(tmpAreaSeries) 'tmpAreaSeries.FillSampleValues(4)End Sub
与在设计时创建的任何系列一样,所有 AreaSeries 属性和方法都可用于新系列。
在同一图表中混合不同系列类的示例是在设计时使用 TeeChart 编辑器将区域(系列(0))、条形(系列(1))和线(系列(2))系列添加到图表中 . 所有访问一个共同的索引结构,图表的系列列表。 使用系列可能如下所示:
[C#]private void Form1_Load(object sender, System.EventArgs e) { //You could add the Series at runtime Steema.TeeChart.Styles.Area area1 = new Steema.TeeChart.Styles.Area(tChart1.Chart); Steema.TeeChart.Styles.Bar bar1 = new Steema.TeeChart.Styles.Bar(tChart1.Chart); Steema.TeeChart.Styles.Line line1 = new Steema.TeeChart.Styles.Line(tChart1.Chart); //Use Series common properties tChart1.Series[0].FillSampleValues(10); tChart1.Series[1].FillSampleValues(10); tChart1.Series[2].FillSampleValues(10); tChart1.Series[1].Marks.Visible = false; tChart1.Series[2].Marks.Visible = false; //Modify Bar specific properties bar1.BarStyle = Steema.TeeChart.Styles.BarStyles.Pyramid; //Change Bar type bar1.Pen.Color = Color.Yellow; //Bar bounding lines colour //Modify Line specific properties line1.Stairs = true; //Set line to Stairs line1.LinePen.Color = Color.Blue; //LineSeries bounding lines colour //Modify Area specific properties area1.AreaBrush.Style = System.Drawing.Drawing2D.HatchStyle.Cross; //Area fill pattern }[VB.Net]Private Sub Form1_Load(ByVal sender As System.Object, ByVal e As System.EventArgs) Handles MyBase.Load 'You could add the Series at runtime Dim Area1 As New Steema.TeeChart.Styles.Area(TChart1.Chart) Dim Bar1 As New Steema.TeeChart.Styles.Bar(TChart1.Chart) Dim Line1 As New Steema.TeeChart.Styles.Line(TChart1.Chart) 'Use Series common properties TChart1.Series(0).FillSampleValues(10) TChart1.Series(1).FillSampleValues(10) TChart1.Series(2).FillSampleValues(10) TChart1.Series(1).Marks.Visible = False TChart1.Series(2).Marks.Visible = False 'Modify Bar specific properties Bar1.BarStyle = Steema.TeeChart.Styles.BarStyles.Pyramid 'Change Bar type Bar1.Pen.Color = Color.Yellow 'Bar bounding lines colour 'Modify Line specific properties Line1.Stairs = True 'Set line to Stairs Line1.LinePen.Color = Color.Blue 'LineSeries bounding lines colour 'Modify Area specific properties Area1.AreaBrush.Style = System.Drawing.Drawing2D.HatchStyle.Cross 'Area fill pattern End Sub
选择系列类型
为图表选择系列类型在很大程度上取决于您自己对图表的要求。 然而,在某些情况下,由于要绘制的变量数量,图表的选择可能取决于哪些系列类型支持输入变量的数量。
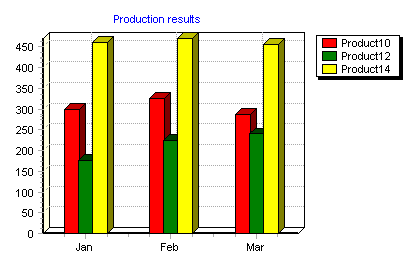
标签可用于扩展 2 变量系列类型的值。 请参阅下面的示例,该示例在同一图表中使用 3 个 Bar Series 类型的实例。
| Product code | Month | Quantity produced |
|---|---|---|
| 10 | Jan | 300 |
| 10 | Feb | 325 |
| 10 | Mar | 287 |
| 12 | Jan | 175 |
| 12 | Feb | 223 |
| 12 | Mar | 241 |
| 14 | Jan | 461 |
| 14 | Feb | 470 |
| 14 | Mar | 455 |
以最简单的形式,数据生成以下图表,按月份对信息进行分组:
代码如下:
[C#]foreach(Steema.TeeChart.Styles.Series tSeries in tChart1.Series){tSeries.Marks.Visible = false;}tChart1.Header.Text = "Production results";bar1.Add(300,"Jan");bar1.Add(325,"Feb");bar1.Add(287,"Mar");bar1.Title = "Product10";bar2.Add(175,"Jan");bar2.Add(223,"Feb");bar2.Add(241,"Mar");bar2.Title = "Product12";bar3.Add(461,"Jan");bar3.Add(470,"Feb");bar3.Add(455,"Mar");bar3.Title = "Product14";[VB.Net]Dim TSeries As Steema.TeeChart.Styles.SeriesFor Each TSeries In TChart1.Series TSeries.Marks.Visible = FalseNextTChart1.Header.Text = "Production results"Bar1.Add(300, "Jan")Bar1.Add(325, "Feb")Bar1.Add(287, "Mar")Bar1.Title = "Product10"Bar2.Add(175, "Jan")Bar2.Add(223, "Feb")Bar2.Add(241, "Mar")Bar2.Title = "Product12"Bar3.Add(461, "Jan")Bar3.Add(470, "Feb")Bar3.Add(455, "Mar")Bar3.Title = "Product14"
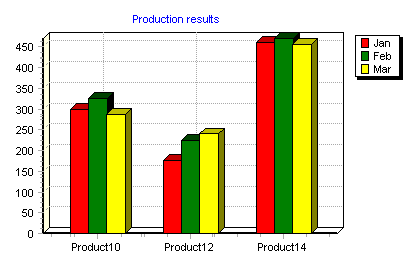
或(按产品分组):
代码如下:
[C#]foreach(Steema.TeeChart.Styles.Series tSeries in tChart1.Series){tSeries.Marks.Visible = false;}tChart1.Header.Text = "Production results";bar1.Add(300,"Product10");bar1.Add(175,"Product12");bar1.Add(461,"Product14");bar1.Title = "Jan";bar2.Add(325,"Product10");bar2.Add(223,"Product12");bar2.Add(470,"Product14");bar2.Title = "Feb";bar3.Add(287,"Product10");bar3.Add(241,"Product12");bar3.Add(455,"Product14");bar3.Title = "Mar";[VB.Net]Dim TSeries As Steema.TeeChart.Styles.SeriesFor Each TSeries In TChart1.Series TSeries.Marks.Visible = FalseNextTChart1.Header.Text = "Production results"Bar1.Add(300, "Product10")Bar1.Add(175, "Product12")Bar1.Add(461, "Product14")Bar1.Title = "Jan"Bar2.Add(325, "Product10")Bar2.Add(223, "Product12")Bar2.Add(470, "Product14")Bar2.Title = "Feb"Bar3.Add(287, "Product10")Bar3.Add(241, "Product12")Bar3.Add(455, "Product14")Bar3.Title = "Mar"
我们在上表(库存)中添加了新值。
| Product code | Month | Quantity produced | Stock level |
|---|---|---|---|
| 10 | Jan | 300 | 600 |
| 10 | Feb | 325 | 715 |
| 10 | Mar | 287 | 676 |
| 12 | Jan | 175 | 245 |
| 12 | Feb | 223 | 270 |
| 12 | Mar | 241 | 315 |
| 14 | Jan | 461 | 800 |
| 14 | Feb | 470 | 755 |
| 14 | Mar | 455 | 835 |
表中的库存值通常高于月产量,因此显示它们会给出以下图表(这次是 2D)。 该图表使用线系列来区分股票。
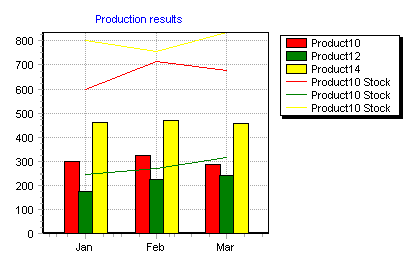
将以下代码添加到前面第一个示例的代码中:
[C#]line1.Add(600,"Jan");line1.Add(715,"Feb");line1.Add(676,"Mar");line1.Title = "Product10 Stock"; line1.Color = bar1.Color;line2.Add(245,"Jan");line2.Add(270,"Feb");line2.Add(315,"Mar");line2.Title = "Product10 Stock";line2.Color = bar2.Color;line3.Add(800,"Jan");line3.Add(755,"Feb");line3.Add(835,"Mar");line3.Title = "Product10 Stock";line3.Color = bar3.Color;[VB.Net]Line1.Add(600, "Jan")Line1.Add(715, "Feb")Line1.Add(676, "Mar")Line1.Title = "Product10 Stock"Line1.Color = Bar1.ColorLine2.Add(245, "Jan")Line2.Add(270, "Feb")Line2.Add(315, "Mar")Line2.Title = "Product10 Stock"Line2.Color = Bar2.ColorLine3.Add(800, "Jan")Line3.Add(755, "Feb")Line3.Add(835, "Mar")Line3.Title = "Product10 Stock"Line3.Color = Bar3.Color
将数据添加到系列
大多数 Series 类型(ADO.NET 数据源教程 8 和函数教程 7 除外)使用 Add 方法的 24 个泛型重载来添加数据。
颜色
添加点时可以手动为点添加颜色
[C#]bar1.Add(50,"Tomatoes",Color.Tomato);[VB.Net]Bar1.Add(50, "Tomatoes", Color.Tomato)
Alternatively, you can allow TeeChart to allocate a colour. TeeChart will choose one of up to 19 unique and as yet unused colours for each new Series, or for each new Series point if Series.ColorEach = True.
[C#]Random rnd = new Random();bar1.ColorEach = true;for(int i = 0; i < 19; ++i) { int higher = i + 65; char letter = (char) higher; bar1.Add(rnd.Next(100),letter.ToString()); } [VB.Net] Dim i As Integer Bar1.ColorEach = True For i = 0 To 19 Bar1.Add(Rnd() * 100, Chr(i + 65)) Next
可以将透明颜色添加到 Point 以保留 ValueList 中的值的空间,而不显示在 Chart 上。
[C#]bar1.Add(45, "My Transparent Bar", Color.Transparent);[VB.Net]Bar1.Add(45, "My Transparent Bar", Color.Transparent)
从系列中删除数据点
使用 Series.Delete 从系列中删除一个点。 Series.Delete 有两个重载:
public Void Delete(System.Int32)
删除系列中的第 n 个点。
public Void Delete(System.Int32, System.Int32)
从系列中的第 n 个点开始删除多个点 n。
[C#]bar1.Delete(7,2); (deletes two points starting from the 8th Series point (index starts at zero))[VB.Net]Bar1.Delete(7, 2) (deletes two points starting from the 8th Series point (index starts at zero))
Series.Clear 清除系列中的所有点。
将空点添加到系列
Series.Add 具有三个重载,可让您将 Null 点添加到系列:
添加一个新的空(透明)点——公共 Int32 添加()
添加具有指定文本的新空点——公共 Int32 添加(System.String)
在具有指定文本的指定 x 值处添加新的空点——公共 Int32 添加(System.Double,System.String)
上述第二个重载将为系列添加一个空点,允许您为该点定义一个标签,但在该点在系列中留下一个中断。 在线系列的情况下,中断前的最后一个点不会连接到中断后的第一个点。
[C#]line1.Add("Null Point");[VB.Net]Line1.Add("Null Point")
如果您想了解TeeChart for .NET正版价格,欢迎咨询在线客服
标签:
来源:慧都
声明:本站部分文章及图片转载于互联网,内容版权归原作者所有,如本站任何资料有侵权请您尽早请联系jinwei@zod.com.cn进行处理,非常感谢!