轻量级流程图控件GoJS甘特图示例
GoJS是一款功能强大,快速且轻量级的流程图控件,可帮助你在JavaScript 和 HTML5 Canvas程序中创建流程图,且极大地简化你的JavaScript / Canvas 程序。本文主要演示一个简单的甘特图。
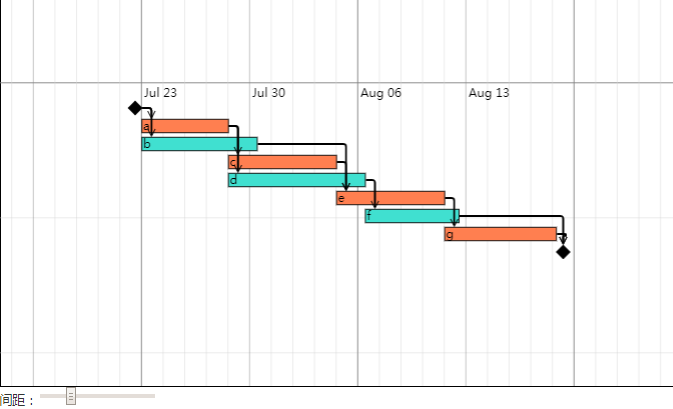

此示例演示了一个简单的甘特图。甘特图用于说明项目进度,表示项目的终端和摘要元素的开始和结束日期。
您可以通过更改“Spacing(间距)”值来放大/缩小图表,该值可以使用节点宽度和位置的数据绑定功能来缩放图表。这种方式取代了通过更改Diagram.scale来进行缩放。
在页面中查看此示例页面的源代码
function init() { if (window.goSamples) goSamples(); // init for these samples -- you don't need to call this var $ = go.GraphObject.make; // for conciseness in defining templates myDiagram = $(go.Diagram, "myDiagramDiv", // Diagram refers to its DIV HTML element by id { _widthFactor: 1, // a scale for the nodes' positions and widths isReadOnly: true, // deny the user permission to alter the diagram or zoom in or out allowZoom: false, "grid.visible": true, // display a grid in the background of the diagram "grid.gridCellSize": new go.Size(30, 150) }); // create the template for the standard nodes myDiagram.nodeTemplateMap.add("", $(go.Node, "Auto", // links come from the right and go to the left side of the top of the node { fromSpot: go.Spot.Right, toSpot: new go.Spot(0.001, 0, 11, 0) }, $(go.Shape, "Rectangle", { height: 15 }, new go.Binding("fill", "color"), new go.Binding("width", "width", function (w) { return scaleWidth(w); })), $(go.TextBlock, { margin: 2, alignment: go.Spot.Left }, new go.Binding("text", "key")), // using a function in the Binding allows the value to // change when Diagram.updateAllTargetBindings is called new go.Binding("location", "loc", function (l) { return new go.Point(scaleWidth(l.x), l.y); }) )); // create the template for the start node myDiagram.nodeTemplateMap.add("start", $(go.Node, { fromSpot: go.Spot.Right, toSpot: go.Spot.Top, selectable: false }, $(go.Shape, "Diamond", { height: 15, width: 15 }), // make the location of the start node is not scalable new go.Binding("location", "loc") )); // create the template for the end node myDiagram.nodeTemplateMap.add("end", $(go.Node, { fromSpot: go.Spot.Right, toSpot: go.Spot.Top, selectable: false }, $(go.Shape, "Diamond", { height: 15, width: 15 }), // make the location of the end node (with location.x < 0) scalable new go.Binding("location", "loc", function(l) { if (l.x >= 0) return new go.Point(scaleWidth(l.x), l.y); else return l; }) )); // create the link template myDiagram.linkTemplate = $(go.Link, { routing: go.Link.Orthogonal, corner: 3, toShortLength: 2, selectable: false }, $(go.Shape, { strokeWidth: 2 }), $(go.Shape, { toArrow: "OpenTriangle" }) ); // add the nodes and links to the model myDiagram.model = new go.GraphLinksModel( [ // node data { key: "a", color: "coral", width: 120, loc: new go.Point(scaleWidth(0), 40) }, { key: "b", color: "turquoise", width: 160, loc: new go.Point(scaleWidth(0), 60) }, { key: "c", color: "coral", width: 150, loc: new go.Point(scaleWidth(120), 80) }, { key: "d", color: "turquoise", width: 190, loc: new go.Point(scaleWidth(120), 100) }, { key: "e", color: "coral", width: 150, loc: new go.Point(scaleWidth(270), 120) }, { key: "f", color: "turquoise", width: 130, loc: new go.Point(scaleWidth(310), 140) }, { key: "g", color: "coral", width: 155, loc: new go.Point(scaleWidth(420), 160) }, { key: "begin", category: "start", loc: new go.Point(-15,20) }, { key: "end", category: "end", loc: new go.Point(scaleWidth(575), 180) } ], [ // link data { from: "begin", to: "a" }, { from: "begin", to: "b" }, { from: "a", to: "c" }, { from: "a", to: "d" }, { from: "b", to: "e" }, { from: "c", to: "e" }, { from: "d", to: "f" }, { from: "e", to: "g" }, { from: "f", to: "end" }, { from: "g", to: "end" } ]); // add a Graduated panel to show the dates, globally scoped dateScale = $(go.Part, "Graduated", { graduatedTickUnit: 1, graduatedMin: 0, graduatedMax: 3, pickable: false, location: new go.Point(0, 0) }, $(go.Shape, { name: "line", strokeWidth: 0, geometryString: "M0 0 H" + scaleWidth(450) } ), $(go.TextBlock, { name: "labels", font: "10pt sans-serif", alignmentFocus: new go.Spot(0, 0, -3, -3), graduatedFunction: function (v) { var d = new Date(2017, 6, 23); d.setDate(d.getDate() + v * 7); // format date output to string var options = { month: "short", day: "2-digit" }; return d.toLocaleDateString("en-US", options); } } ) ); myDiagram.add(dateScale); } // scale the number according to the current widthFactor function scaleWidth(num) { return num * myDiagram._widthFactor; } // change the grid's cell size and the widthFactor, // then update Bindings to scale the widths and positions of nodes, // as well as the width of the date scale function rescale() { var val = parseFloat(document.getElementById("widthSlider").value); myDiagram.startTransaction("rescale"); myDiagram.grid.gridCellSize = new go.Size(val, 150); myDiagram._widthFactor = val / 30; myDiagram.updateAllTargetBindings(); // update width of date scale and maybe change interval of labels if too small var width = scaleWidth(450); dateScale.findObject("line").geometryString = "M0 0 H" + width; if (width >= 140) dateScale.findObject("labels").interval = 1; if (width < 140) dateScale.findObject("labels").interval = 2; if (width < 70) dateScale.findObject("labels").interval = 4; myDiagram.commitTransaction("rescale"); } <div id="sample"> <div id="myDiagramDiv" style="height:600px;width:100%;border:1px solid black"></div> <div id="slider"> <label>Spacing:</label> <input id="widthSlider" type="range" min="2" max="90" value="30" onchange="rescale()"> </div> <p> This sample demonstrates a simple Gantt chart. Gantt charts are used to illustrate project schedules, denoting the start and end dates for terminal and summary elements of the project. </p> <p> You can zoom in on the diagram by changing the "Spacing" value, which scales the diagram using a data binding function for nodes' widths and locations. This is in place of changing the <a>Diagram.scale</a>. </p></div>
在GitHub上查看此示例页面的源代码
想查看在线操作示例,可以点击此处。
想要购买GoJS正版授权,或者获取更多该产品相关信息的朋友可以点击” 咨询在线客服 “~
标签:甘特图JavaScript HTML5图表流程图
来源:慧都
声明:本站部分文章及图片转载于互联网,内容版权归原作者所有,如本站任何资料有侵权请您尽早请联系jinwei@zod.com.cn进行处理,非常感谢!