这是一个基本演示,展示了如何通过使用 qml 来使用不同的图表类型。
Qt技术交流交流群,QQ搜索群号“7654444821”加入
Qt组件推荐
-
这是一个基本的演示,展示了如何通过使用 qml 来使用不同的图表类型。

默认情况下,应用程序使用动态测试数据来模拟天气。您还可以从 http://www.worldweatheronline.com/ 获取应用程序 ID,以访问 World Weather Online 提供的天气 API。然后,您可以将您的应用程序 ID 作为参数提供给 Qml Weather 可执行文件,以便使用实时数据。
例如:
binqmlweather .exe 1234567890abcdef123456运行示例
要从 Qt Creator 运行示例,请打开欢迎模式并从示例中选择示例。有关更多信息,请访问构建和运行示例。
在 Qt Quick 应用程序中使用图表
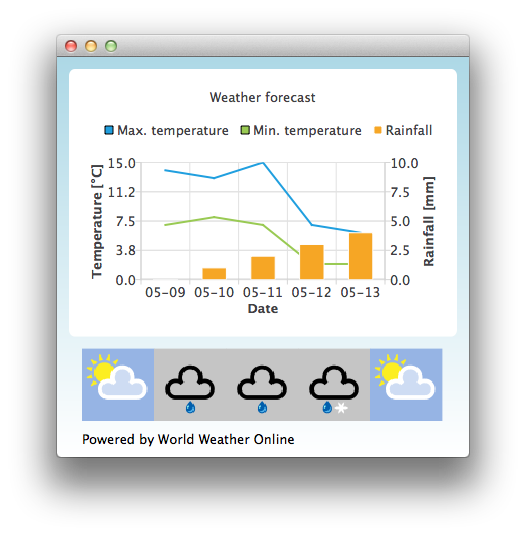
示例应用程序使用ChartView和一些系列来可视化天气数据:
ChartView { id: chartView title: "Weather forecast" BarCategoryAxis { id: barCategoriesAxis titleText: "Date" } ValueAxis{ id: valueAxisY2 min: 0 max: 10 titleText: "Rainfall [mm]" } ValueAxis { id: valueAxisX // Hide the value axis; it is only used to map the line series to bar categories axis visible: false min: 0 max: 5 } ValueAxis{ id: valueAxisY min: 0 max: 15 titleText: "Temperature [°C]" } LineSeries { id: maxTempSeries axisX: valueAxisX axisY: valueAxisY name: "Max. temperature" } LineSeries { id: minTempSeries axisX: valueAxisX axisY: valueAxisY name: "Min. temperature" } BarSeries { id: myBarSeries axisX: barCategoriesAxis axisYRight: valueAxisY2 BarSet { id: rainfallSet label: "Rainfall" } }为了获取与环境数据的数据,我们以 JSON 数据格式请求响应。
var xhr = new XMLHttpRequest;xhr.open("GET", "http://free.worldweatheronline.com/feed/weather.ashx=Jyv%c3%a4skyl%c3%a4,Finland&format=json&num_of_days=5&key=" + weatherAppKey);xhr.onreadystatechange = function() { if (xhr.readyState == XMLHttpRequest.DONE) { var a = JSON.parse(xhr.responseText); parseWeatherData(a); }}xhr.send();JSON响应包含一组预测数据:
for (var i in weatherData.data.weather) { var weatherObj = weatherData.data.weather[i];然后将其家具我们系列的输入数据和调用图标URL容器的ListModel:
// Store temperature values, rainfall and weather icon.// The temperature values begin from 0.5 instead of 0.0 to make the start from the// middle of the rainfall bars. This makes the temperature lines visually better// synchronized with the rainfall bars.maxTempSeries.append(Number(i) + 0.5, weatherObj.tempMaxC);minTempSeries.append(Number(i) + 0.5, weatherObj.tempMinC);rainfallSet.append(i, weatherObj.precipMM);weatherImageModel.append({"imageSource":weatherObj.weatherIconUrl[0].value});================================================== ==
想要了解或购买Qt正版授权的朋友,欢迎咨询官方客服
Qt技术交流交流群开放,QQ搜索群号“7654444821”或者扫描二维码加入

标签:
来源:慧都
声明:本站部分文章及图片转载于互联网,内容版权归原作者所有,如本站任何资料有侵权请您尽早请联系jinwei@zod.com.cn进行处理,非常感谢!