本文主要介绍如何使用LightningChart创建带有鼠标点跟踪和注释的 3D 图表。
Arction Ltd从事高性能的大数据可视化研发近15年,其下产品LightningChart处于行业绝对领先水平,本使用教程将会带您学会如何使用
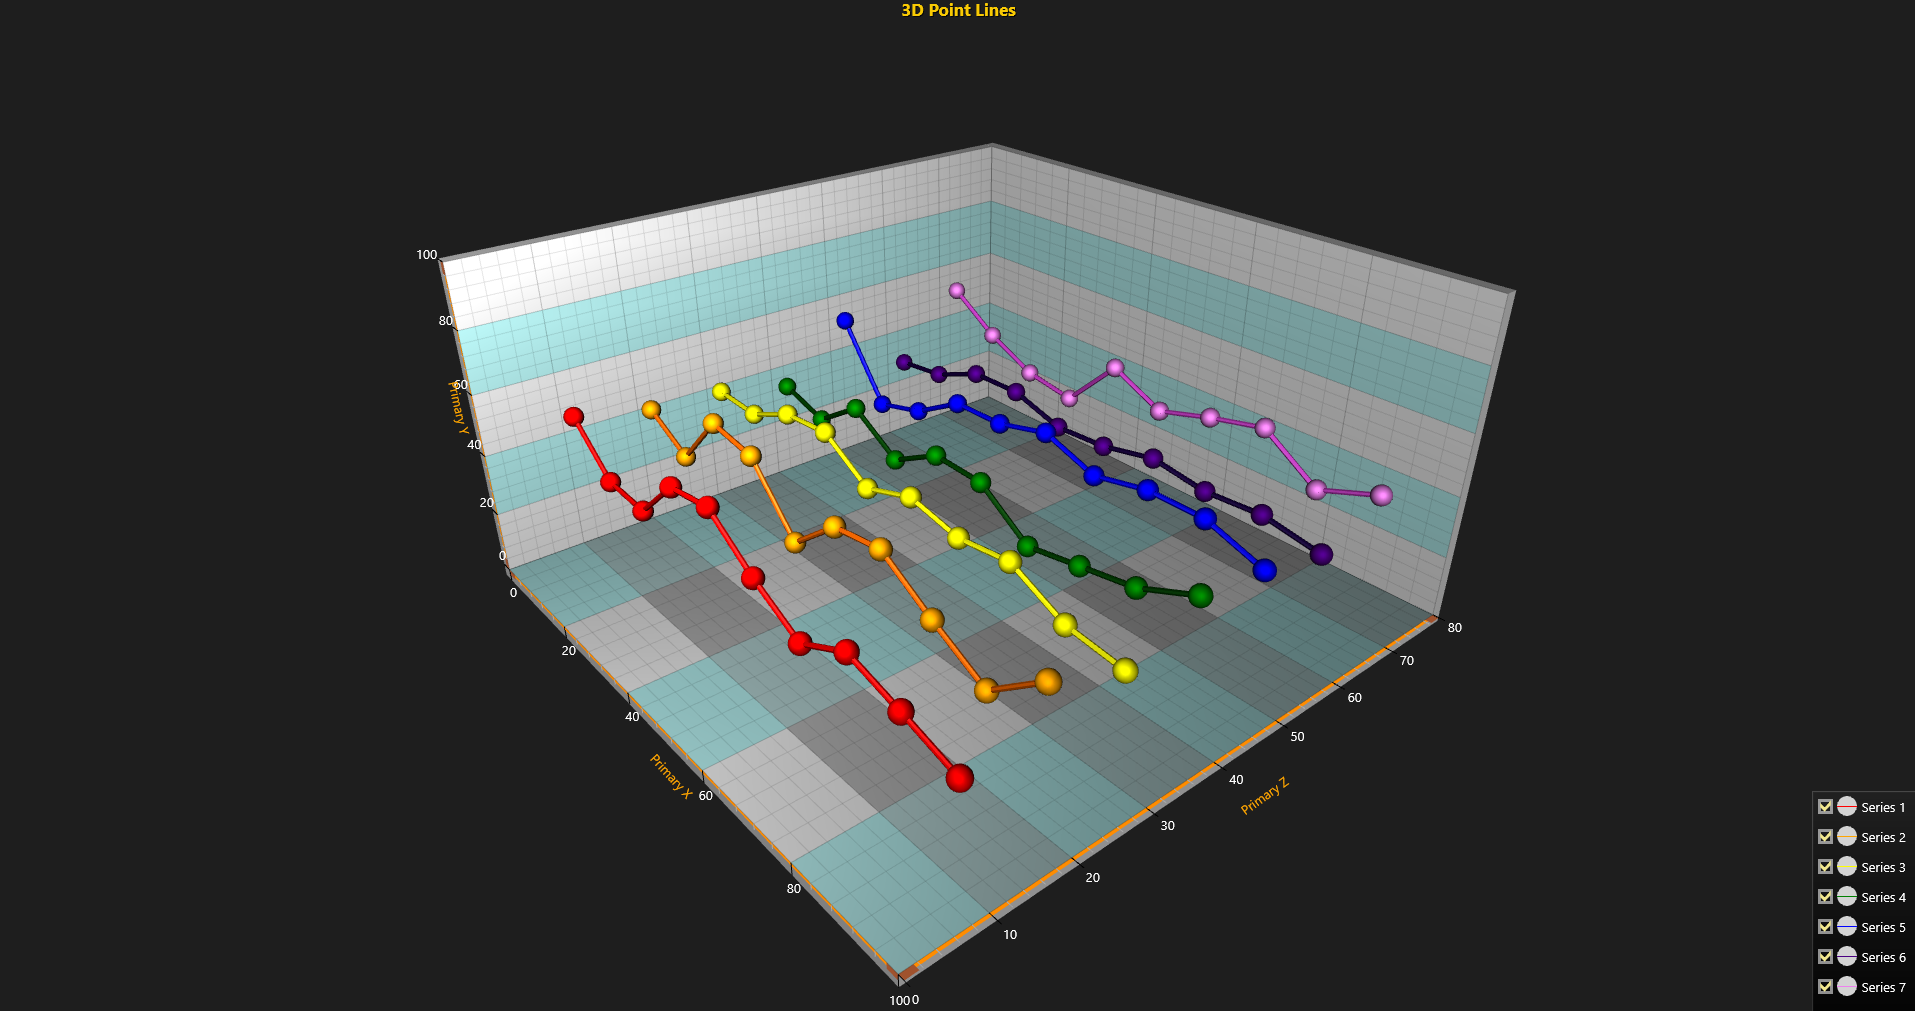
本教程介绍如何使用PointLineSeries3D在 3D 图表中呈现点和线,如何使用鼠标创建多个点系列和跟踪点值。跟踪值使用注释显示,允许在图表区域的任何位置显示标签或图形。

1. 将 View3D 定义为活动视图并定义 Z 轴范围。
// Set View3D as active view and set Z-axis range.chart.ActiveView = ActiveView.View3D;chart.View3D.ZAxisPrimary3D.SetRange(0, 80);
2. 创建一个新的 PointLineSeries3D 对象来显示数据。
// Create a new PointLineSeries3D for displaying data and set axis bindings to primary axes.var series = new PointLineSeries3D(chart.View3D, Axis3DBinding.Primary, Axis3DBinding.Primary, Axis3DBinding.Primary){ // Set this to true to set a color for individual points. IndividualPointColors = true, // Set this to true in order for mouse tracking to work. MouseInteraction = true};
3. 将样式应用于新创建的系列。
// Set a title to the series.series.Title.Text = "Series 0";// Set point shape to a sphere.series.PointStyle.Shape3D = PointShape3D.Sphere;// Set individual point size.series.PointStyle.Size3D.SetValues(3, 3, 3);// Set the width of the line between points.series.LineStyle.Width = 0.4f;// Draw the line between points with the same color as the points.series.LineStyle.LineOptimization = LineOptimization.NormalWithShading; // Set a color to the line.series.LineStyle.Color = Color.FromArgb(255, 255, 0, 0);
4.为数据点创建一个SeriesPoint3D数组并添加数据。
// Create a SeriesPoint3D array for data points.SeriesPoint3D[] points = new SeriesPoint3D[10];// Generate sample data to the array.for (int j = 0; j < 10; j++) { // Random values for data points. points[j].X = 5 + j * 10; points[j].Y = 30 + random.NextDouble() * 25.0; points[j].Z = 10 + i * 10; // You can set an individual color to each point with the Color property. points[j].Color = Color.FromArgb(255, 255, 0, 0); } // Set the points array to series Points property. series.Points = points; // Add the series to chart's View3D. chart.View3D.PointLineSeries3D.Add(series);
5.创建一个Annotation来显示鼠标跟踪值
// Create a new annotation to display target values when hovering over a point with the mouse.mouseAnnotation = new Annotation3D(chart.View3D, Axis3DBinding.Primary, Axis3DBinding.Primary, Axis3DBinding.Primary){ // Set the annotation as invisible by default. Visible = false, // Set the annotations target location coordinates to use axis values. TargetCoordinateSystem = AnnotationTargetCoordinates.AxisValues, // Set the annotations location to use relative screen coordinates to target. LocationCoordinateSystem = CoordinateSystem.RelativeCoordinatesToTarget, // Disable mouse interaction with the annotation. MouseInteraction = false};// Set offset to annotation.mouseAnnotation.LocationRelativeOffset.SetValues(40, -70);// Add annotation to View3D.chart.View3D.Annotations.Add(mouseAnnotation);
6. 向图表添加 MouseMove 事件处理程序以启用点跟踪
chart.MouseMove += Chart_MouseMove;
7. 创建鼠标移动事件处理函数
private void Chart_MouseMove(object sender, System.Windows.Input.MouseEventArgs e){ // Call BeginUpdate for chart to disable rendering while mouse is moving // over the chart to improve performance. chart.BeginUpdate(); // Set label visible when not hovered over by mouse. mouseAnnotation.Visible = false; // Check if any object has been found under the mouse. object obj = chart.GetActiveMouseOverObject(); if (obj != null) { // Check if the active mouse over object is a PointLineSeries object. if (obj is PointLineSeries3D) { PointLineSeries3D pointLineSeries3D = obj as PointLineSeries3D; // Get the point last hit by mouse. int pointIndex = pointLineSeries3D.LastMouseHitTestIndex; SeriesPoint3D point = pointLineSeries3D.Points[pointIndex]; // Set annotation position to the moused over point. mouseAnnotation.TargetAxisValues.SetValues(point.X, point.Y, point.Z); // Set annotation text to display information about the moused over point. mouseAnnotation.Text = "Series index: " + chart.View3D.PointLineSeries3D.IndexOf(pointLineSeries3D).ToString() + "nPoint index: " + pointIndex.ToString() + "nX=" + point.X.ToString("0.0") + " ; Y=" + point.Y.ToString("0.0") + " ; Z=" + point.Z.ToString("0.0"); // Set the annotation visible while mouse is hovering over the point. mouseAnnotation.Visible = true; } } // Call EndUpdate to enable rendering again after handling mouse move event. chart.EndUpdate();}
点击进入下一章:LightningChart .NET使用教程(十):3D SurfaceGrid 图表
如果您对该图表控件感兴趣,欢迎加入图表控件QQ交流群:
如果你想了解LightningChart.NET正版价格,欢迎查看产品介绍或咨询在线客服
标签:
来源:慧都
声明:本站部分文章及图片转载于互联网,内容版权归原作者所有,如本站任何资料有侵权请您尽早请联系jinwei@zod.com.cn进行处理,非常感谢!