本文主要介绍在LightningChart中如何制作带有 CustomAxisTicks 的 2D BarSeries 图表。
Arction Ltd从事高性能的大数据可视化研发近15年,其下产品LightningChart处于行业绝对领先水平,本使用教程将会带您学会如何使用
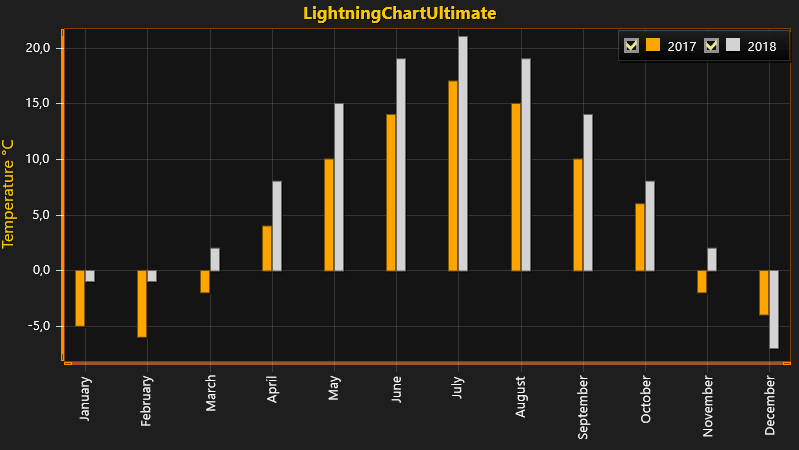
本教程解释了如何使用两个BarSeries创建一个简单的 2D 图表。
BarSeries将数据值表示为矩形条形,它可用于以非常清晰的方式可视化数据之间的差异和差异。
在本教程中, BarSeries用于表示两年期间的月平均温度。
本教程假设您已在WinForms 或 WPF 应用程序上使用LightningChart创建了一个新图表。如果没有,请按照我们的简单 2D 图表创建应用程序。

1. 创建一个新的 BarSeries 并为创建的系列添加样式。
您可以使用System.Windows.Media.Color或System.Drawing.Color定义颜色,具体取决于您使用的是 WPF 还是 WinForms。
// Create a new BarSeries.var barSeries1 = new BarSeries(chart.ViewXY, axisX, axisY); // Add styling to created series.barSeries1.Fill.Color = Color.FromRgb(255, 165, 0); // Orange.barSeries1.Fill.GradientFill = GradientFill.Solid;barSeries1.Title.Text = "2017";barSeries1.BarThickness = 10;
2. 生成数据作为 BarSeriesValues 来表示平均每月温度并将它们添加到 BarSeries。
// Generate data as BarSeriesValues.BarSeriesValue[] bars1 = new BarSeriesValue[]{ new BarSeriesValue(0, -5, null), new BarSeriesValue(1, -6, null), new BarSeriesValue(2, -2, null), new BarSeriesValue(3, 4, null), new BarSeriesValue(4, 10, null), new BarSeriesValue(5, 14, null), new BarSeriesValue(6, 17, null), new BarSeriesValue(7, 15, null), new BarSeriesValue(8, 10, null), new BarSeriesValue(9, 6, null), new BarSeriesValue(10, -2, null), new BarSeriesValue(11, -4, null)};// Add BarSeriesValues to BarSeries.barSeries1.Values = bars1;
3. 将 BarSeries 添加到图表中。
// Add BarSeries to chart.chart.ViewXY.BarSeries.Add(barSeries1);
4. 创建第二个 BarSeries 并为创建的系列添加样式。
// Create second BarSeries.var barSeries2 = new BarSeries();// Add styling to created series.barSeries2.Fill.Color = Color.FromRgb(211, 211, 211); // LightGray.barSeries2.Fill.GradientFill = GradientFill.Solid;barSeries2.Title.Text = "2018";barSeries2.BarThickness = 10;
5. 生成另一组数据作为 BarSeriesValues 来表示平均每月温度并将它们添加到 BarSeries。
BarSeriesValue[] bars2 = new BarSeriesValue[]{ new BarSeriesValue(0, -1, null), new BarSeriesValue(1, -1, null), new BarSeriesValue(2, 2, null), new BarSeriesValue(3, 8, null), new BarSeriesValue(4, 15, null), new BarSeriesValue(5, 19, null), new BarSeriesValue(6, 21, null), new BarSeriesValue(7, 19, null), new BarSeriesValue(8, 14, null), new BarSeriesValue(9, 8, null), new BarSeriesValue(10, 2, null), new BarSeriesValue(11, -7, null)};// Add BarSeriesValues to BarSeries.barSeries2.Values = bars2;
6. 将 BarSeries 添加到图表中。
// Add BarSeries to chart.chart.ViewXY.BarSeries.Add(barSeries2);
LightningChart提供BarViewOptions属性,用于自定义条形图在图表上的显示方式。
BarViewOptions.Grouping允许将条形图设置为按值索引、使用宽度拟合的索引或按位置值绘制图表。
在本教程中,分组是使用ByLocation -option 完成的。
7. 为 BarSeries 配置条形视图布局。
// Configure bar view layout.chart.ViewXY.BarViewOptions.Grouping = BarsGrouping.ByLocation;
LightningChart提供了使用CustomAxisTicks将您自己的自定义刻度添加为轴值的可能性。在本教程中, CustomAxisTicks用于将月份名称显示为 X 轴值。
// Create list of months.string[] months = new string[]{ "January", "February", "March", "April", "May", "June", "July", "August", "September", "October", "November", "December"};// Create CustomAxisTicks to display months as X-axis values.for (int i = 0; i < months.Length; i++) { CustomAxisTick tick = new CustomAxisTick(axisX); tick.AxisValue = i; tick.LabelText = months[i]; tick.Color = Color.FromArgb(35, 255, 255, 255); axisX.CustomTicks.Add(tick); } // Notify chart about set custom axis ticks. axisX.InvalidateCustomTicks();
注意
为了正确显示自定义轴刻度,请记住将 AutoFormatLabels 属性设置为 false 并将 CustomTicksEnabled 属性设置为 true。
// Disable autoformating of labels.axisX.AutoFormatLabels = false;// Enable CustomAxisTicks.axisX.CustomTicksEnabled = true;
点击进入下一章:LightningChart .NET使用教程(七):用于呈现财务数据的 2D StockSeries 图表
如果您对该图表控件感兴趣,欢迎加入图表控件QQ交流群:
如果你想了解LightningChart.NET正版价格,欢迎查看产品介绍或咨询在线客服
标签:
来源:慧都
声明:本站部分文章及图片转载于互联网,内容版权归原作者所有,如本站任何资料有侵权请您尽早请联系jinwei@zod.com.cn进行处理,非常感谢!