Web图表控件ChartDirector连载教程分享之简单条形图,内附下载和链接。
ChartDirector是一个非常理想的图表工具,它拥有广泛的图表类型、分层架构、实时互动的大数据表、普遍适应于各种应用程序以及支持PDF和SVG图标等的优点。此系列连载旨在介绍ChartDirector的实用教程,供大家学习讨论。
一、简单条形图(一)
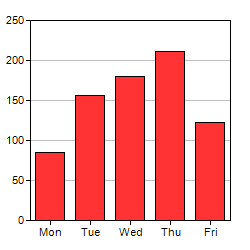

此示例演示了创建条形图的基本步骤:
- 使用XYChart.XYChart创建XYChart对象。
- 使用XYChart.setPlotArea指定图表的绘图区域。绘图区域是由x和y轴限定的矩形。您应该在绘图区域的外部留出一些边距,用于轴标签,图表标题等。
- 使用Axis.setLabels在x轴上指定标签。
- 添加条形图层并使用XYChart.addBarLayer指定条形图的数据。
- 使用图表生成BaseChartmakeChart。
源代码清单
以下代码可在“cppdemo/simplebar”中找到。MfC版本的代码可在“mfcdemo / mfcdemo”中找到(仅限Windows版本)。QT版本的代码可在“qtdemo/qtdemo”中找到。
#include "chartdir.h"int main(int argc, char *argv[]){ // The data for the bar chart double data[] = {85, 156, 179.5, 211, 123}; // The labels for the bar chart const char *labels[] = {"Mon", "Tue", "Wed", "Thu", "Fri"}; // Create a XYChart object of size 250 x 250 pixels XYChart *c = new XYChart(250, 250); // Set the plotarea at (30, 20) and of size 200 x 200 pixels c->setPlotArea(30, 20, 200, 200); // Add a bar chart layer using the given data c->addBarLayer(DoubleArray(data, (int)(sizeof(data) / sizeof(data[0])))); // Set the labels on the x axis. c->xAxis()->setLabels(StringArray(labels, (int)(sizeof(labels) / sizeof(labels[0])))); // Output the chart c->makeChart("simplebar.png"); //free up resources delete c; return 0;}
二、简单条形图(二)
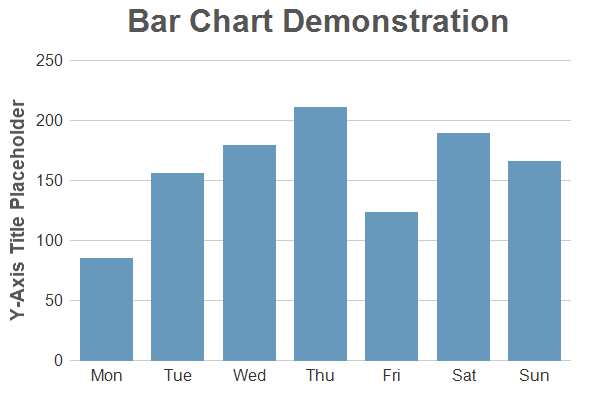
此示例扩展了简单条形图(一)示例,以演示控制图表外观和添加标题的各种方法:
- 使用XYChart.setPlotArea将绘图区域配置为具有透明边框和浅灰色(CCCCCC)网格线。
- 使用BaseChart.addTitle和Axis.setTitle添加图表和轴标题。
- 使用Axis.setColors将轴干和刻度设置为Transparent。
- 使用Axis.setLabelStyle将标签样式设置为灰色12pt Arial。
- 使用XYChart.addBarLayer添加浅海军蓝色(6699BB)的条形图层。
- 使用Layer.setBorderColor将边框颜色配置为“Transparent”以禁用条形边框。
- 使用Axis.setTickDensity为自动生成的标签配置最小标签间距。虽然图表在更多轴标签上会更精确(只要它们不重叠),但由于美学原因,有时需要较少的标签。设置最小标签间距可以控制标签密度,而无需知道将生成多少标签。
源代码清单
以下代码可在“cppdemo/simplebar”中找到。MfC版本的代码可在“mfcdemo / mfcdemo”中找到(仅限Windows版本)。QT版本的代码可在“qtdemo/qtdemo”中找到。
#include "chartdir.h"int main(int argc, char *argv[]){ // The data for the bar chart double data[] = {85, 156, 179, 211, 123, 189, 166}; // The labels for the bar chart const char *labels[] = {"Mon", "Tue", "Wed", "Thu", "Fri", "Sat", "Sun"}; // Create a XYChart object of size 600 x 400 pixels XYChart *c = new XYChart(600, 400); // Add a title box using grey (0x555555) 24pt Arial Bold font c->addTitle(" Bar Chart Demonstration", "arialbd.ttf", 24, 0x555555); // Set the plotarea at (70, 60) and of size 500 x 300 pixels, with transparent background and // border and light grey (0xcccccc) horizontal grid lines c->setPlotArea(70, 60, 500, 300, Chart::Transparent, -1, Chart::Transparent, 0xcccccc); // Set the x and y axis stems to transparent and the label font to 12pt Arial c->xAxis()->setColors(Chart::Transparent); c->yAxis()->setColors(Chart::Transparent); c->xAxis()->setLabelStyle("arial.ttf", 12); c->yAxis()->setLabelStyle("arial.ttf", 12); // Add a blue (0x6699bb) bar chart layer with transparent border using the given data c->addBarLayer(DoubleArray(data, (int)(sizeof(data) / sizeof(data[0]))), 0x6699bb )->setBorderColor(Chart::Transparent); // Set the labels on the x axis. c->xAxis()->setLabels(StringArray(labels, (int)(sizeof(labels) / sizeof(labels[0])))); // For the automatic y-axis labels, set the minimum spacing to 40 pixels. c->yAxis()->setTickDensity(40); // Add a title to the y axis using dark grey (0x555555) 14pt Arial Bold font c->yAxis()->setTitle("Y-Axis Title Placeholder", "arialbd.ttf", 14, 0x555555); // Output the chart c->makeChart("simplebar2.png"); //free up resources delete c; return 0;}
想要购买ChartDirector正版授权,或者获取更多该产品相关信息的朋友可以点击” 咨询在线客服 “~
海量产品正在参加年终大促,价格优惠!详情请点击” 年终巅峰钜惠 “~
标签:Web图表交互图表
来源:慧都
声明:本站部分文章及图片转载于互联网,内容版权归原作者所有,如本站任何资料有侵权请您尽早请联系jinwei@zod.com.cn进行处理,非常感谢!