本文主要讲解在Stimulsoft中从代码打印数据网格
【下载Stimulsoft Reports.Ultimate最新版本】
此示例显示如何从代码中打印数据网格,数据网格是以表格形式呈现的数据,在Form1_Load事件中创建并填充数据集合:
private void Form1_Load(object sender, System.EventArgs e){ DataTable table = new DataTable("Demo"); table.Columns.Add(); table.Columns.Add(); DataRow row1 = table.NewRow(); DataRow row2 = table.NewRow(); DataRow row3 = table.NewRow(); row1.ItemArray = new string[2]{"1", "One"}; row2.ItemArray = new string[2]{"2", "Two"}; row3.ItemArray = new string[2]{"3", "Three"}; table.Rows.Add(row1); table.Rows.Add(row2); table.Rows.Add(row3); dataView1.Table = table;}
更详细地看一下PrintDataGrid方法,首先在dictionary中创建一个新的报表和数据源:
private void PrintDataGrid(DataGrid sender){ DataView dataView = (DataView)sender.DataSource; StiReport report = new StiReport(); report.ScriptLanguage = StiReportLanguageType.CSharp; //Add data to datastore report.RegData("view", dataView); //Fill dictionary report.Dictionary.Synchronize();...
向报表添加Data Band和Header Band:
... StiPage page = report.Pages.Items[0]; //Create HeaderBand StiHeaderBand headerBand = new StiHeaderBand(); headerBand.Height = 0.5f; headerBand.Name = "HeaderBand"; page.Components.Add(headerBand); //Create DataBand StiDataBand dataBand = new StiDataBand(); dataBand.DataSourceName = "view" + dataView.Table.TableName; dataBand.Height = 0.5f; dataBand.Name = "DataBand"; page.Components.Add(dataBand);...
将Text Boxes参照上数据源字段Data Band,和Text Boxes与数据的Header Band:
... //Create texts Double pos = 0; Double columnWidth = StiAlignValue.AlignToMinGrid(page.Width / dataView.Table.Columns.Count, 0.1, true); int nameIndex = 1; foreach (DataColumn column in dataView.Table.Columns) { //Create text on header StiText headerText = new StiText(new RectangleD(pos, 0, columnWidth, 0.5f)); headerText.Text.Value = column.Caption; headerText.HorAlignment = StiTextHorAlignment.Center; headerText.Name = "HeaderText" + nameIndex.ToString(); headerText.Brush = new StiSolidBrush(Color.LightGreen); headerText.Border.Side = StiBorderSides.All; headerBand.Components.Add(headerText); //Create text on Data Band StiText dataText = new StiText(new RectangleD(pos, 0, columnWidth, 0.5f)); dataText.Text.Value = "{view" + dataView.Table.TableName + "." + Stimulsoft.Report.CodeDom.StiCodeDomSerializator.ReplaceSymbols(column.ColumnName) + "}"; dataText.Name = "DataText" + nameIndex.ToString(); dataText.Border.Side = StiBorderSides.All; //Add highlight StiCondition condition = new StiCondition(); condition.BackColor = Color.CornflowerBlue; condition.TextColor = Color.Black; condition.Expression = "(Line & 1) == 1"; condition.Item = StiFilterItem.Expression; dataText.Conditions.Add(condition); dataBand.Components.Add(dataText); pos += columnWidth; nameIndex ++; }...
然后,添加一个Footer Band与Text Box的报表显示出Total值:
... //Create FooterBand StiFooterBand footerBand = new StiFooterBand(); footerBand.Height = 0.5f; footerBand.Name = "FooterBand"; page.Components.Add(footerBand); //Create text on footer StiText footerText = new StiText(new RectangleD(0, 0, page.Width, 0.5f)); footerText.Text.Value = "Count - {Count()}"; footerText.HorAlignment = StiTextHorAlignment.Right; footerText.Name = "FooterText"; footerText.Brush = new StiSolidBrush(Color.LightGreen); footerBand.Components.Add(footerText);...
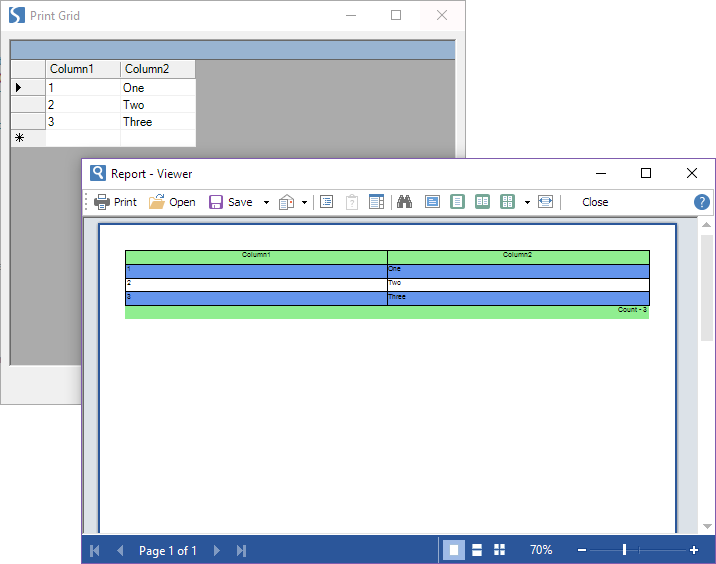
最后,渲染报表并在查看器中显示它:
... //Render without progress bar report.Render(false); report.Show();}
示例代码的结果如下图所示:

下载示例
标签:报表解决方案报表报表控件报表设计GridStimulsoftWinForms
来源:慧都
声明:本站部分文章及图片转载于互联网,内容版权归原作者所有,如本站任何资料有侵权请您尽早请联系jinwei@zod.com.cn进行处理,非常感谢!