ChartDirector 6.3(C ++版)教程分享——多饼图
ChartDirector是一个功能强大的图表组件,用于为Web和Windows应用程序创建专业的图表。主要功能包括:
- 综合图表样式:包括馅饼,甜甜圈,酒吧,线,样条,阶梯线,趋势,曲线拟合,线间着色,面积,散点图,泡沫,浮动框,盒须,瀑布,金融,甘特,矢量,轮廓,热图,表面,3D散射,雷达,极线,极地,极地样条,极地散射,极地泡沫,极地矢量,玫瑰,金字塔,锥和漏斗。可以交换x和y轴。条形图可以是水平或垂直的,折线图和其他XY图表样式也是如此。许多图表样式也支持3D效果。
- 仪表和仪表:包括水平和垂直方向的可配置角度范围,线性仪表和条形仪表的角度计。
- 复杂金融图表:特别支持撰写复杂的金融图表 – 烛台,OHLC,成交量,移动平均线,价格区间,RSI,MACD,随机指标,动能,抛物线SAR,ROC,OBV以及众多其他技术指标。
想要了解更详细的产品介绍请点击这里。
ChartDirector提供以下编程语言和组件技术。
- ASP / COM / Visual Basic / VBScript / JScript
- .NET(C#,VB,C ++ / CLI和其他CLI语言)
- Java
- PHP
- Perl
- 蟒蛇
- 红宝石
- ColdFusion
- C ++
ChartDirector for Java和ColdFusion是用纯Java编写的,与平台无关。Windows支持用于ASP / COM / VB和.NET的ChartDirector。Windows,Linux和MacOS支持PHP,Perl,Python,Ruby和C ++的ChartDirector。
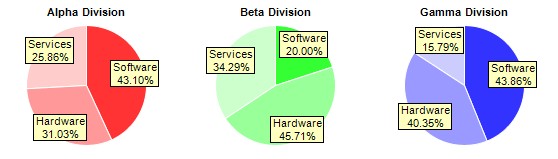

此示例演示了使用不同数据和颜色绘制多个饼图。它还演示了在行业上使用标签和使用行业边界。
- 扇区颜色使用BaseChart.setColors2指定。
- 扇区都使用PieChart.setLineColor设置白色边框。周边的边界是不可见的,因为它们与背景颜色相同。馅饼内部的部门边界成为各部门之间的分界线。
- 扇区标签配置有淡黄色背景和黑色边框。这是通过获取文本框代表使用部门标签原型对象PieChart.setLabelStyle,然后调用它的Box.setBackground方法。
- 通过使用具有负标签位置的PieChart.setLabelLayout,扇区标签在饼图内移动。
源代码清单
以下代码可在“cppdemo / multipie”中找到。Mf版本的代码可在“mfcdemo / mfcdemo”中找到(仅限Windows版本)。QT版本的代码可在“qtdemo / qtdemo”中找到。
#include "chartdir.h"void createChart(int chartIndex, const char *filename){ // The data for the pie chart double data0[] = {25, 18, 15}; double data1[] = {14, 32, 24}; double data2[] = {25, 23, 9}; // The labels for the pie chart const char *labels[] = {"Software", "Hardware", "Services"}; // Create a PieChart object of size 180 x 160 pixels PieChart *c = new PieChart(180, 160); // Set the center of the pie at (90, 80) and the radius to 60 pixels c->setPieSize(90, 80, 60); // Set the border color of the sectors to white (ffffff) c->setLineColor(0xffffff); // Set the background color of the sector label to pale yellow (ffffc0) with a black border // (000000) c->setLabelStyle()->setBackground(0xffffc0, 0x000000); // Set the label to be slightly inside the perimeter of the circle c->setLabelLayout(Chart::CircleLayout, -10); // Set the title, data and colors according to which pie to draw if (chartIndex == 0) { c->addTitle("Alpha Division", "arialbd.ttf", 8); c->setData(DoubleArray(data0, (int)(sizeof(data0) / sizeof(data0[0]))), StringArray(labels, (int)(sizeof(labels) / sizeof(labels[0])))); int pattern1[] = {0xff3333, 0xff9999, 0xffcccc}; c->setColors(Chart::DataColor, IntArray(pattern1, (int)(sizeof(pattern1) / sizeof(pattern1[0 ])))); } else if (chartIndex == 1) { c->addTitle("Beta Division", "arialbd.ttf", 8); c->setData(DoubleArray(data1, (int)(sizeof(data1) / sizeof(data1[0]))), StringArray(labels, (int)(sizeof(labels) / sizeof(labels[0])))); int pattern2[] = {0x33ff33, 0x99ff99, 0xccffcc}; c->setColors(Chart::DataColor, IntArray(pattern2, (int)(sizeof(pattern2) / sizeof(pattern2[0 ])))); } else { c->addTitle("Gamma Division", "arialbd.ttf", 8); c->setData(DoubleArray(data2, (int)(sizeof(data2) / sizeof(data2[0]))), StringArray(labels, (int)(sizeof(labels) / sizeof(labels[0])))); int pattern3[] = {0x3333ff, 0x9999ff, 0xccccff}; c->setColors(Chart::DataColor, IntArray(pattern3, (int)(sizeof(pattern3) / sizeof(pattern3[0 ])))); } // Output the chart c->makeChart(filename); //free up resources delete c;}int main(int argc, char *argv[]){ createChart(0, "multipie0.png"); createChart(1, "multipie1.png"); createChart(2, "multipie2.png"); return 0;}
想要下载详细文档请点击这里
标签:图表
来源:慧都
声明:本站部分文章及图片转载于互联网,内容版权归原作者所有,如本站任何资料有侵权请您尽早请联系jinwei@zod.com.cn进行处理,非常感谢!